
Ultrasound Sweep Data Visualization on ITK-SNAP
Loading ultrasound sweep data
Step 1: Launch ITK-SNAP
Open ITK-SNAP. You will be greeted with the Welcome to ITK-SNAP window. Click on the 'Open Image' button if you are opening your first image, or go to File > Open Main Image... if ITK-SNAP is already running.
Step 2: Load your .mha file
In the dialog that appears, navigate to the folder containing your .mha files. Select the file you want to open and click 'Open'. Once loaded, you'll see your ultrasound sweep data displayed in the top-left panel.
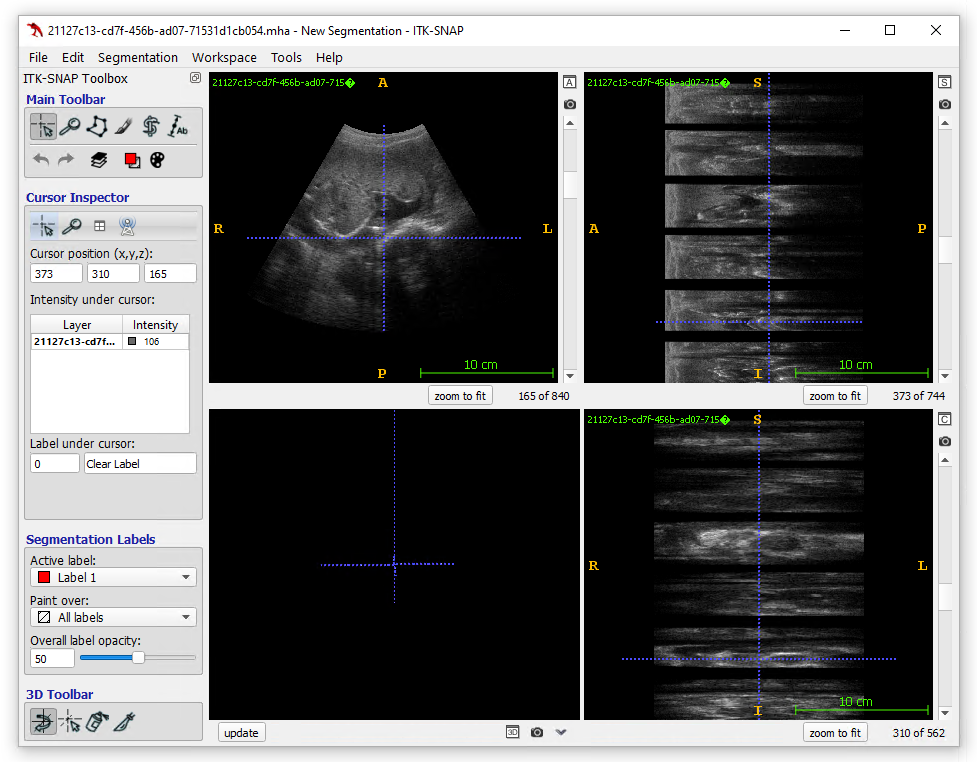 Figure 1: Example visualization of
ultrasound sweep data on ITK-SNAP.
Figure 1: Example visualization of
ultrasound sweep data on ITK-SNAP.
Step 3: Understanding the multi-panel layout
The ITK-SNAP workspace is divided into several panels, each offering a different view of your data.
To the right, the top and bottom views each display a stack of six gray rectangles with smaller black ones interspersed between them. This is a visual representation of your image sweep data, showing the individual frames in a compact manner.
The main image panel is located in the top left corner. You can use it to visualize the images and scroll through the different frames. At the bottom of this panel, the current frame number is displayed (here frame 165, out of a total of 840 in a case). Please note that ITK-SNAP numbering starts from 1, not zero.
Step 4: Navigating the image stacks
Each gray rectangle corresponds to a stack of images from one sweep. The black rectangles represent moments when the ultrasound probe was lifted, indicating a break between sweeps.
You'll notice that each sweep consists of approximately 140 images. This includes both the 'active' images (gray) and the 'detached' or non-ultrasound images (black).
To navigate through the different sweeps, you can click on the desired gray rectangle. This will bring the corresponding frame into view in the main image panel.
Overlaying annotation masks
Step 1: Load ultrasound data
Start by opening your ultrasound image in ITK-SNAP as previously detailed.
Step 2: Load annotation data
To overlay segmentation data (annotations), go to the Segmentation menu and select Open Segmentation.... In the open file dialog, navigate to the folder that contains your segmentation data file. Select the segmentation file corresponding to your ultrasound image and click Open. Then, click on Next and Finish. Alternatively, you can drag and drop this file on top of the ultrasound image already displayed in ITK-SNAP and select "Load as Segmentation" in the prompt you will get.

Figure 2: Loading an annotation file as a segmentation overlay on ITK-SNAP.
Step 3: Visualizing the annotation overlays
The annotation file will load as an overlay on top of your main image. It will be displayed over the images. Annotations are shown as colored overlays—typically, one color for optimal planes and another for suboptimal planes for abdominal circumference measurement.
Use the Cursor Inspector on the left sidebar to view details about the pixel under the cursor, including the intensity and label.

Figure 3: Visualizing the annotation overlays on ITK-SNAP.
Step 4: Adjusting visualization settings
You may want to adjust the visibility of the annotations to better visualize the underlying ultrasound image. Use the 'Segmentation Labels' section in the bottom left panel to adjust the 'Overall label opacity'.